Correlate with School Support Data
Do schools with more counselors, social workers, or psychologists have fewer allegations?
We conducted a log-transformed linear regression to explore this question. Key results are visualized below:
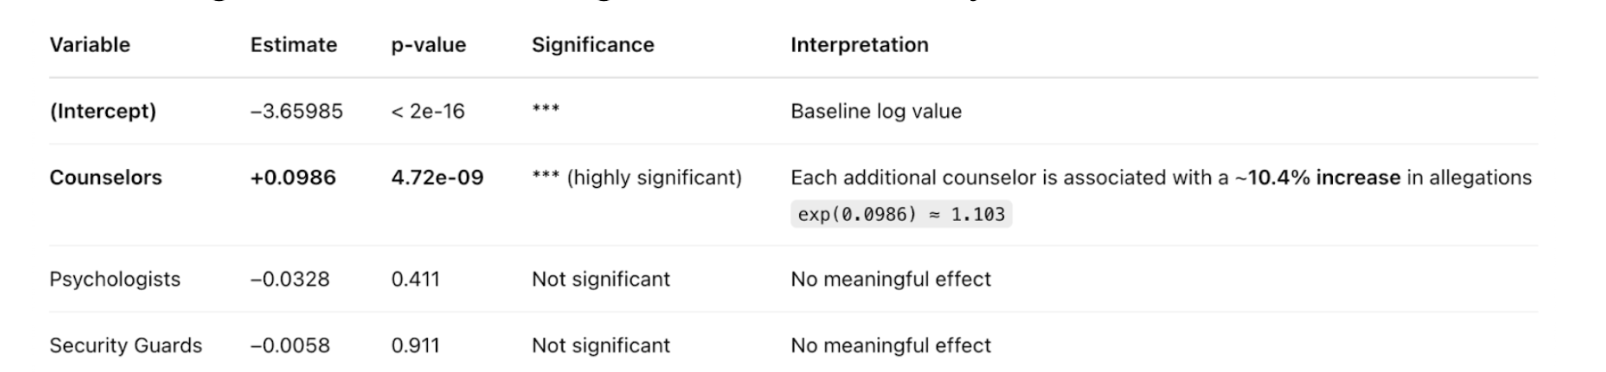
Only SCH_FTECOUNSELORS showed a significant effect — but in the opposite direction than expected. Each additional counselor is associated with a 9.86% increase in the reported harassment & bullying rate per 100 students (on a log scale).
Psychologists and security guards did not show statistically significant effects.
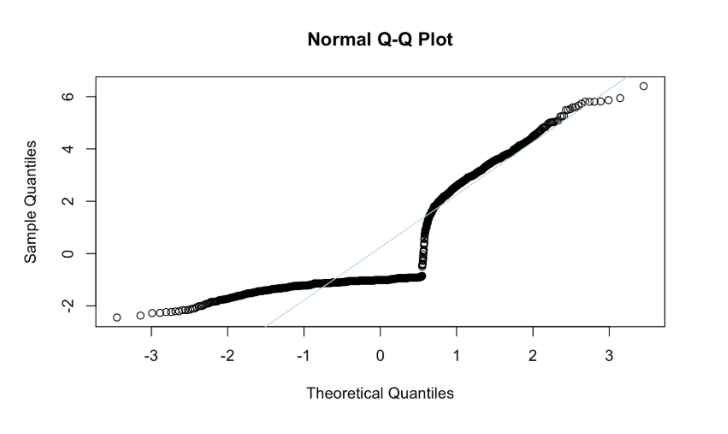
This unexpected result might be due to heteroscedasticity, as shown in the QQ-plot below:
Compare Demographics
Are schools with higher percentages of vulnerable student groups (e.g., LGBTQ+, students with disabilities, etc.) more likely to have higher rates?
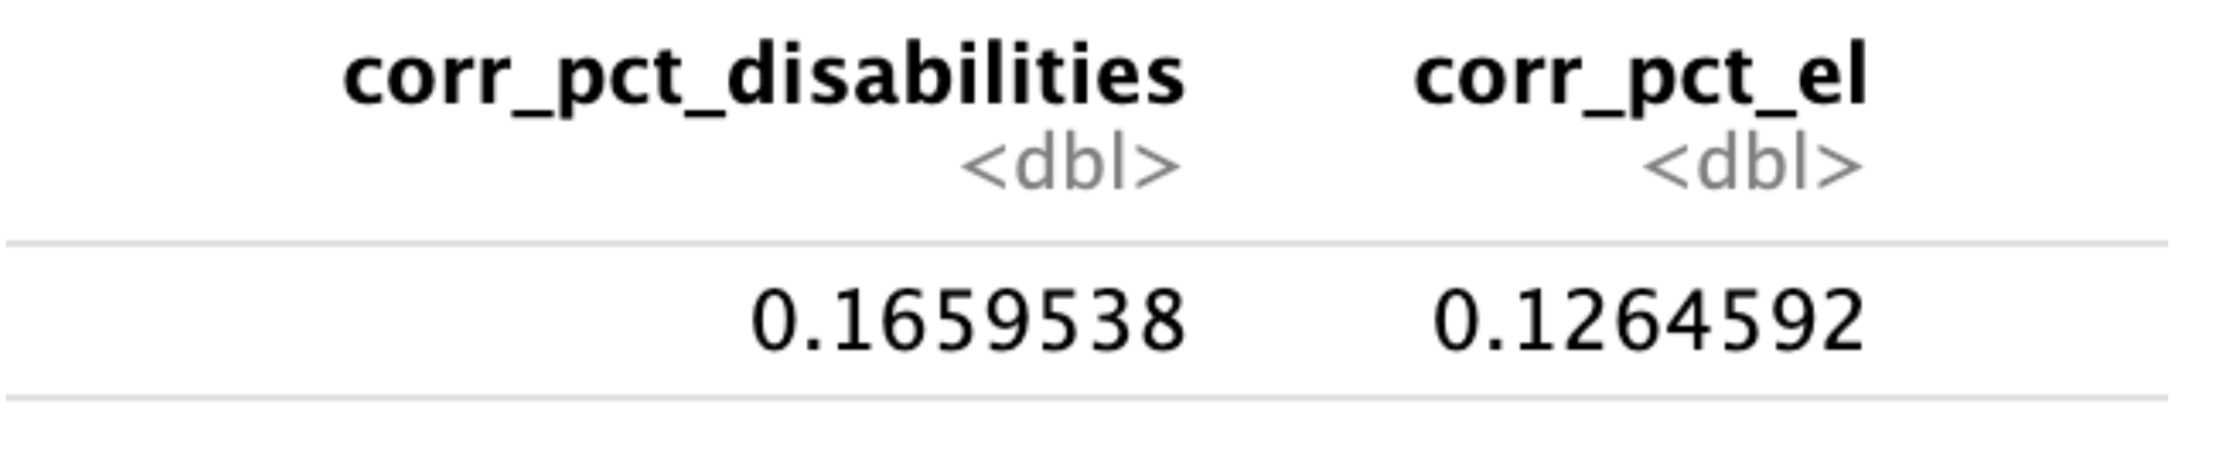
- 0.166 indicates a weak positive association between the percentage of students with disabilities and allegation rates.
- 0.126 shows a similar weak association for English learners.
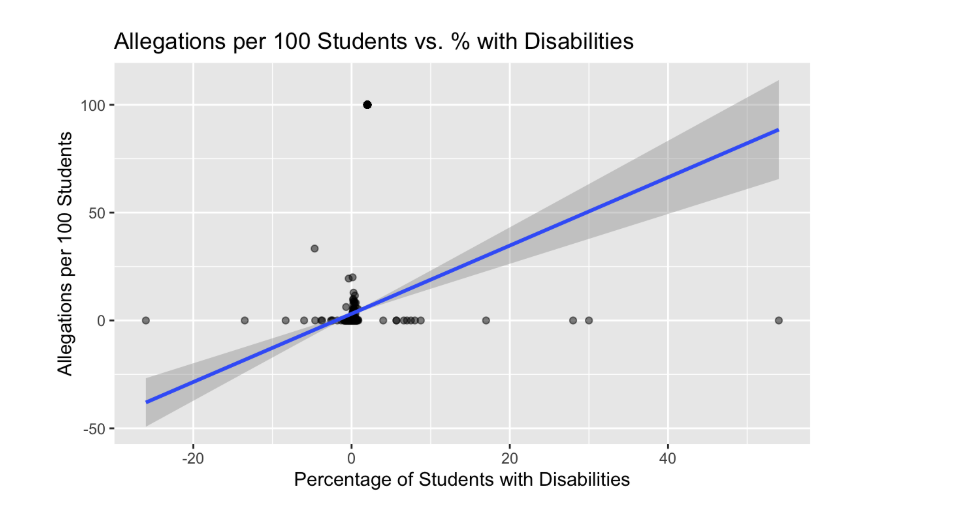
This plot shows a positive linear trend: as the percentage of students with disabilities increases, the allegations per 100 students also tend to increase.
There is an outlier—two schools with very high disability percentages and very high allegation rates (nearly 100%).
Can I normalize within demographic groups to explore equity more deeply?
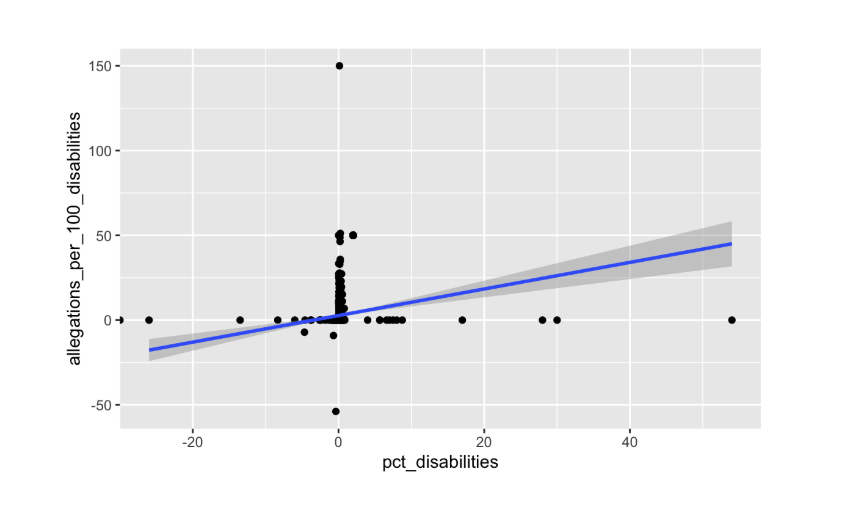
Based on the above plot, we conclude that students with disabilities may be experiencing higher rates of allegations in schools where they are a larger proportion of the population.
Code Summary
The core logic this week included:
- Cleaning and transforming allegation counts
- Joining with total student enrollment
- Calculating per-100-student rates
- Mapping with
ggplot2andmap_data("state")
- Building a reusable function for category-specific maps