1 Introduction
This week, we decided to do some data exploration on our dataset in order to understand and visualize some patterns. We looked at various factors such as religion, race, orientation, and sex, and plotted the number of harassment and bullying cases across all schools available in the dataset.
These plots will give us insight into which groups are facing discrimination more than others, and help us identify patterns to focus on for the final version of the project.
2 Religion
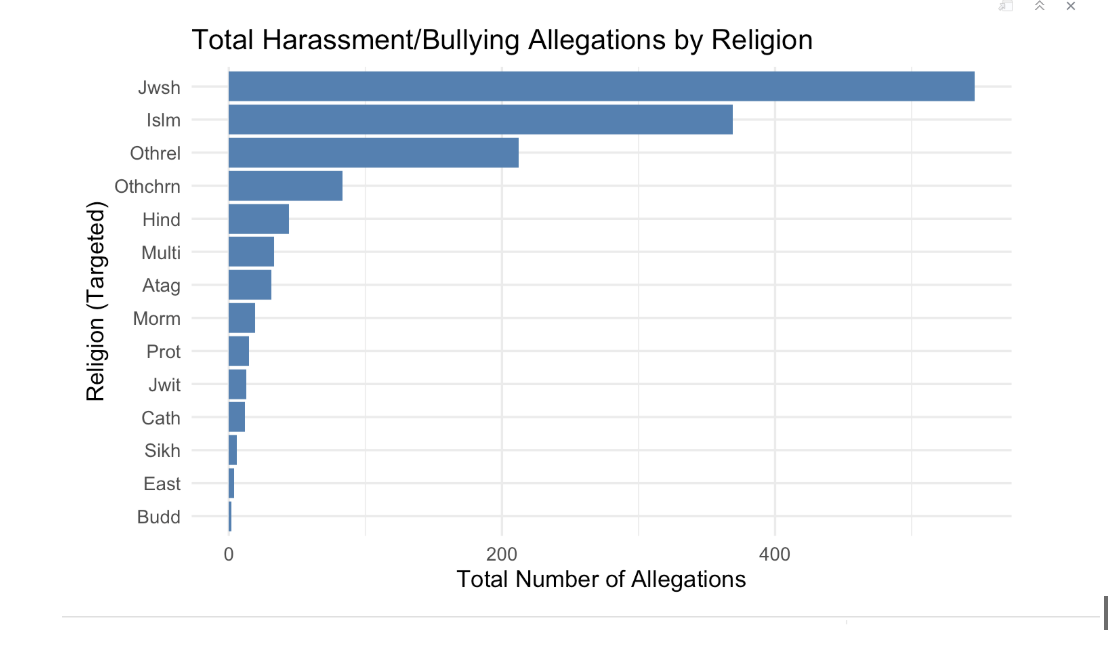
This plot shows the amount of harassment and bullying cases reported by religion.
- The most reports were by Jewish children, followed by Muslim children.
- A low number of allegations against Buddhist children reflects a smaller population size.
3 Sex
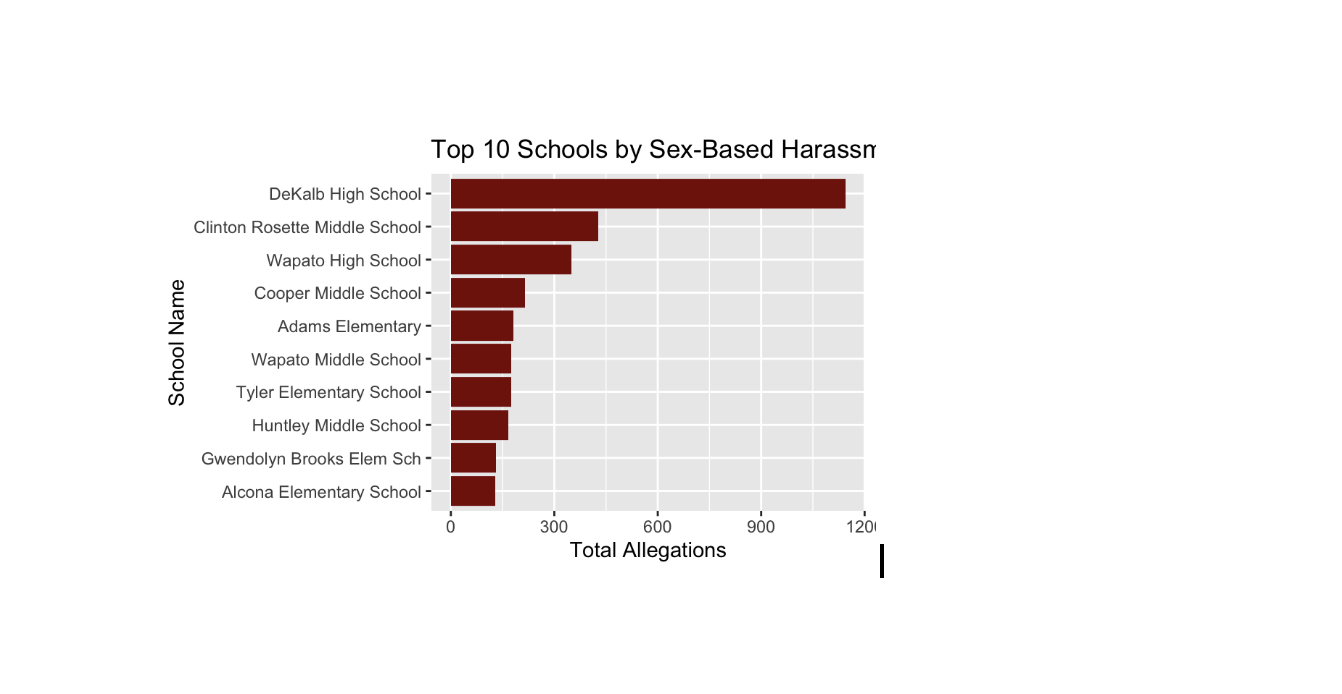
For this graph, we looked at sex-based allegations by schools to find concerning trends.
- Dekalb High School had significantly more cases than any other school — nearly three times as many.
4 Disabilities
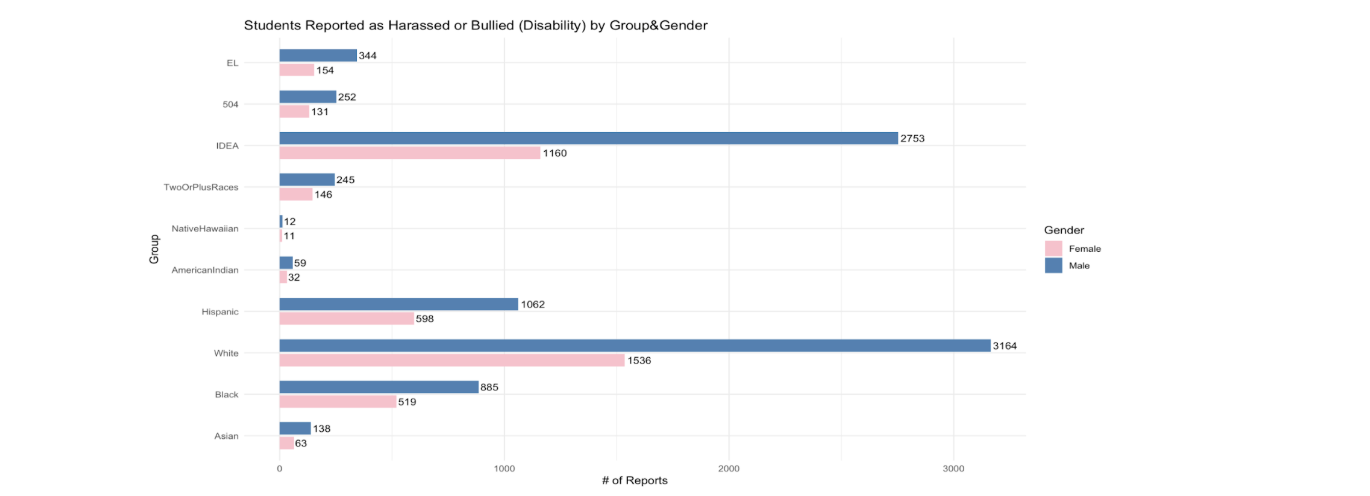
This bar chart shows the number of students reported as harassed or bullied due to disability, broken down by student group and gender.
- White and IDEA male students had the highest number of reported cases.
- Across all groups, males reported more harassment than females.
5 State
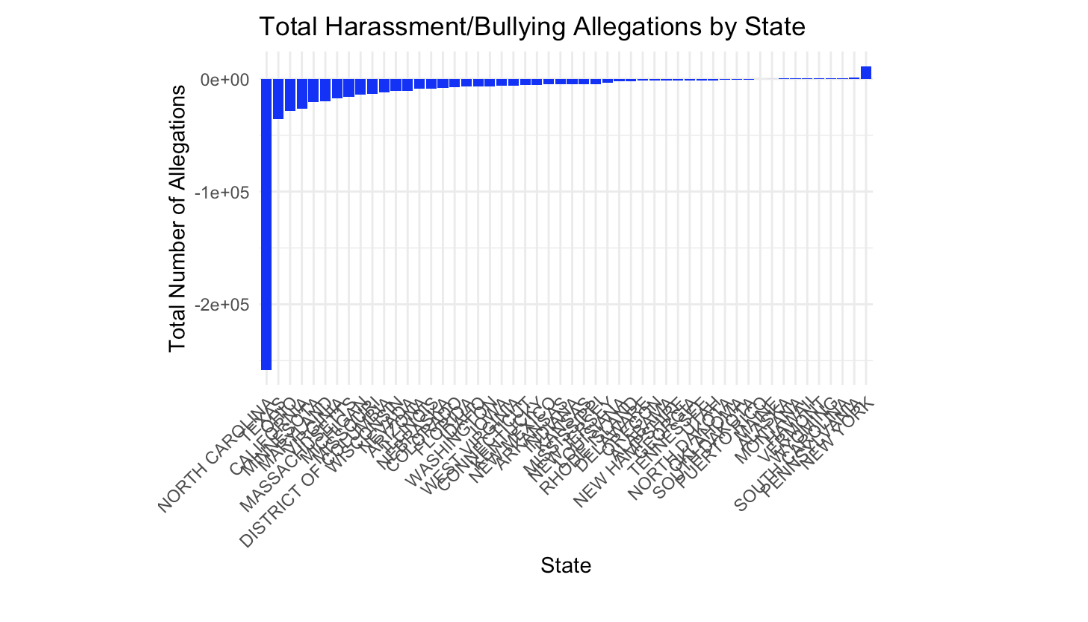
This plot shows the total number of harassment and bullying allegations in each state.
- New York had the highest total.
- This might reflect better reporting mechanisms, higher diversity, or actual higher incident rates.
6 Conclusion
Moving forward, we would like to focus on one or more of these factors (race, religion, sex, orientation) in more depth. We plan to look at statewide discrepancies and highlight significant extremities where certain groups are disproportionately targeted.