Blog post 4 Our dataset: https://www.nber.org/research/data/vital-statistics-natality-birth-data
As always, make lots of plots and try different types of plots. However, for this week’s post, only include at most 2 figures/tables/output for your EDA and at most 1 figure/table/output for the modeling. Try to put together figures that illustrate the main lesson’s you’ve learned this week.
Main Variables As mentioned previously, the main goal of our analysis is to observe the factors that influence a child’s weight at birth. Hence, our response variable comes naturally as “dbwt” or the birth weight in grams. We decided to observe the impact of numerous predictor variables on the birth weight, including:
“mager”: Mother’s age of pregnancy “cig_before” (our variable): A variable we created that observes mothers who’ve smoked before pregnancy (“cig_0”), but not during(0 values for cig_1,cig_2, and cig_3) “cig_during” (our variable): A variable we created that observes mothers who’ve smoked during pregnancy (positive values in cig_1, cig_2, cig_3, cig_0) “cig_none” (our variable): A variable we created that observes whether or not the mother smoked at all “rf_gdiab”: Gestational diabetes “previs”: Number of prenatal visits “meduc”: Mother’s education in years “bmi”: Mother’s BMI
Column Transformations We have transformed the cig_0 (daily number of cigarettes before pregnancy), cig_1 (daily number of cigarettes during 1st trimester), cig_2 (daily number of cigarettes during 2nd trimester), and cig_3 (daily number of cigarettes during 3rd trimester) variables, to create two new dummy variables: “cig_before”, “cig_during”, and “cig_none”. These dummy variables would show whether or not smoking only before, during, or none at all affect the weight of the infant.
Linear Modeling for First child birth age
Residual standard error: 4.402 on 99990 degrees of freedom Multiple R-squared: 0.412, Adjusted R-squared: 0.412 F-statistic: 7785 on 9 and 99990 DF, p-value: < 2.2e-16
In the linear regression analysis conducted, the dependent variable was the maternal age at first child’s birth (mager), modeled as a function of various maternal characteristics and health-related behaviors. The independent variables in the model included maternal education (meduc), height (m_ht_in), Body Mass Index (BMI), pre-pregnancy weight (pwgt_r), weight at delivery (dwgt_r), marital status (Married), presence of gestational diabetes (GDiabetes), and smoking habits before and during pregnancy (cig_before and cig_during, respectively). The results revealed that each of these factors had a statistically significant impact on the age at which a woman has her first child. Notably, maternal education emerged as a particularly influential factor, with the analysis indicating that each additional unit of education was associated with an increase of approximately 1.6 years in the age at first birth, controlling for other factors. This finding aligns with existing literature that suggests higher education levels often correlate with delayed childbearing. Other significant predictors included marital status and gestational diabetes, with married women and those with gestational diabetes having their first child at an older age. The model’s adjusted R-squared value was 0.412, indicating that approximately 41.2% of the variance in maternal age at first birth could be explained by the included predictors. This substantial proportion underscores the importance of these factors in understanding patterns of maternal age at first birth. The statistical significance of the model was confirmed with an F-statistic of 7785 on 9 and 99990 degrees of freedom, and a p-value of less than 2.2e-16, reinforcing the model’s robustness and the reliability of its predictions.
Modeling for Baby weight
Residual standard error: 582.1 on 99989 degrees of freedom Multiple R-squared: 0.04285, Adjusted R-squared: 0.04276 F-statistic: 447.7 on 10 and 99989 DF, p-value: < 2.2e-16
In this linear regression model, the dependent variable is the baby’s birth weight (dbwt), examined in relation to a set of maternal factors similar to those considered in the previous analysis. The independent variables encompass maternal age at first birth (mager), education level (meduc), height (m_ht_in), BMI, pre-pregnancy weight (pwgt_r), delivery weight (dwgt_r), marital status (Married), gestational diabetes (GDiabetes), and smoking habits before and during pregnancy (cig_before and cig_during). The model’s findings reveal that these factors are statistically significant predictors of birth weight, albeit with varying degrees of impact.Notably, maternal height and marital status were positively associated with higher birth weights, with each unit increase in height resulting in an 18.73-gram increase in birth weight. Conversely, smoking during pregnancy (cig_during) had a substantial negative impact, with each unit increase in this variable associated with a 387.74-gram decrease in birth weight, highlighting the significant adverse effects of smoking during pregnancy on fetal development. The effect of maternal age was negative, indicating a slight decrease in birth weight as maternal age increased.
However, the overall explanatory power of this model, as indicated by the adjusted R-squared value (0.04276), suggests that only about 4.28% of the variability in birth weight is accounted for by these variables. This is significantly lower compared to the previous model predicting maternal age at first birth, where approximately 41.2% of the variance was explained. This difference might reflect the complex and multifaceted nature of factors influencing birth weight, many of which could be outside the scope of the variables considered in this model. The model’s statistical significance is affirmed by an F-statistic of 447.7 on 10 and 99989 degrees of freedom, with a p-value of less than 2.2e-16. Despite its statistical significance, the relatively low adjusted R-squared value underlines the necessity of considering additional or different factors to better understand and predict birth weight variations.
Diagram of Birth Age vs Prepreg Education Level 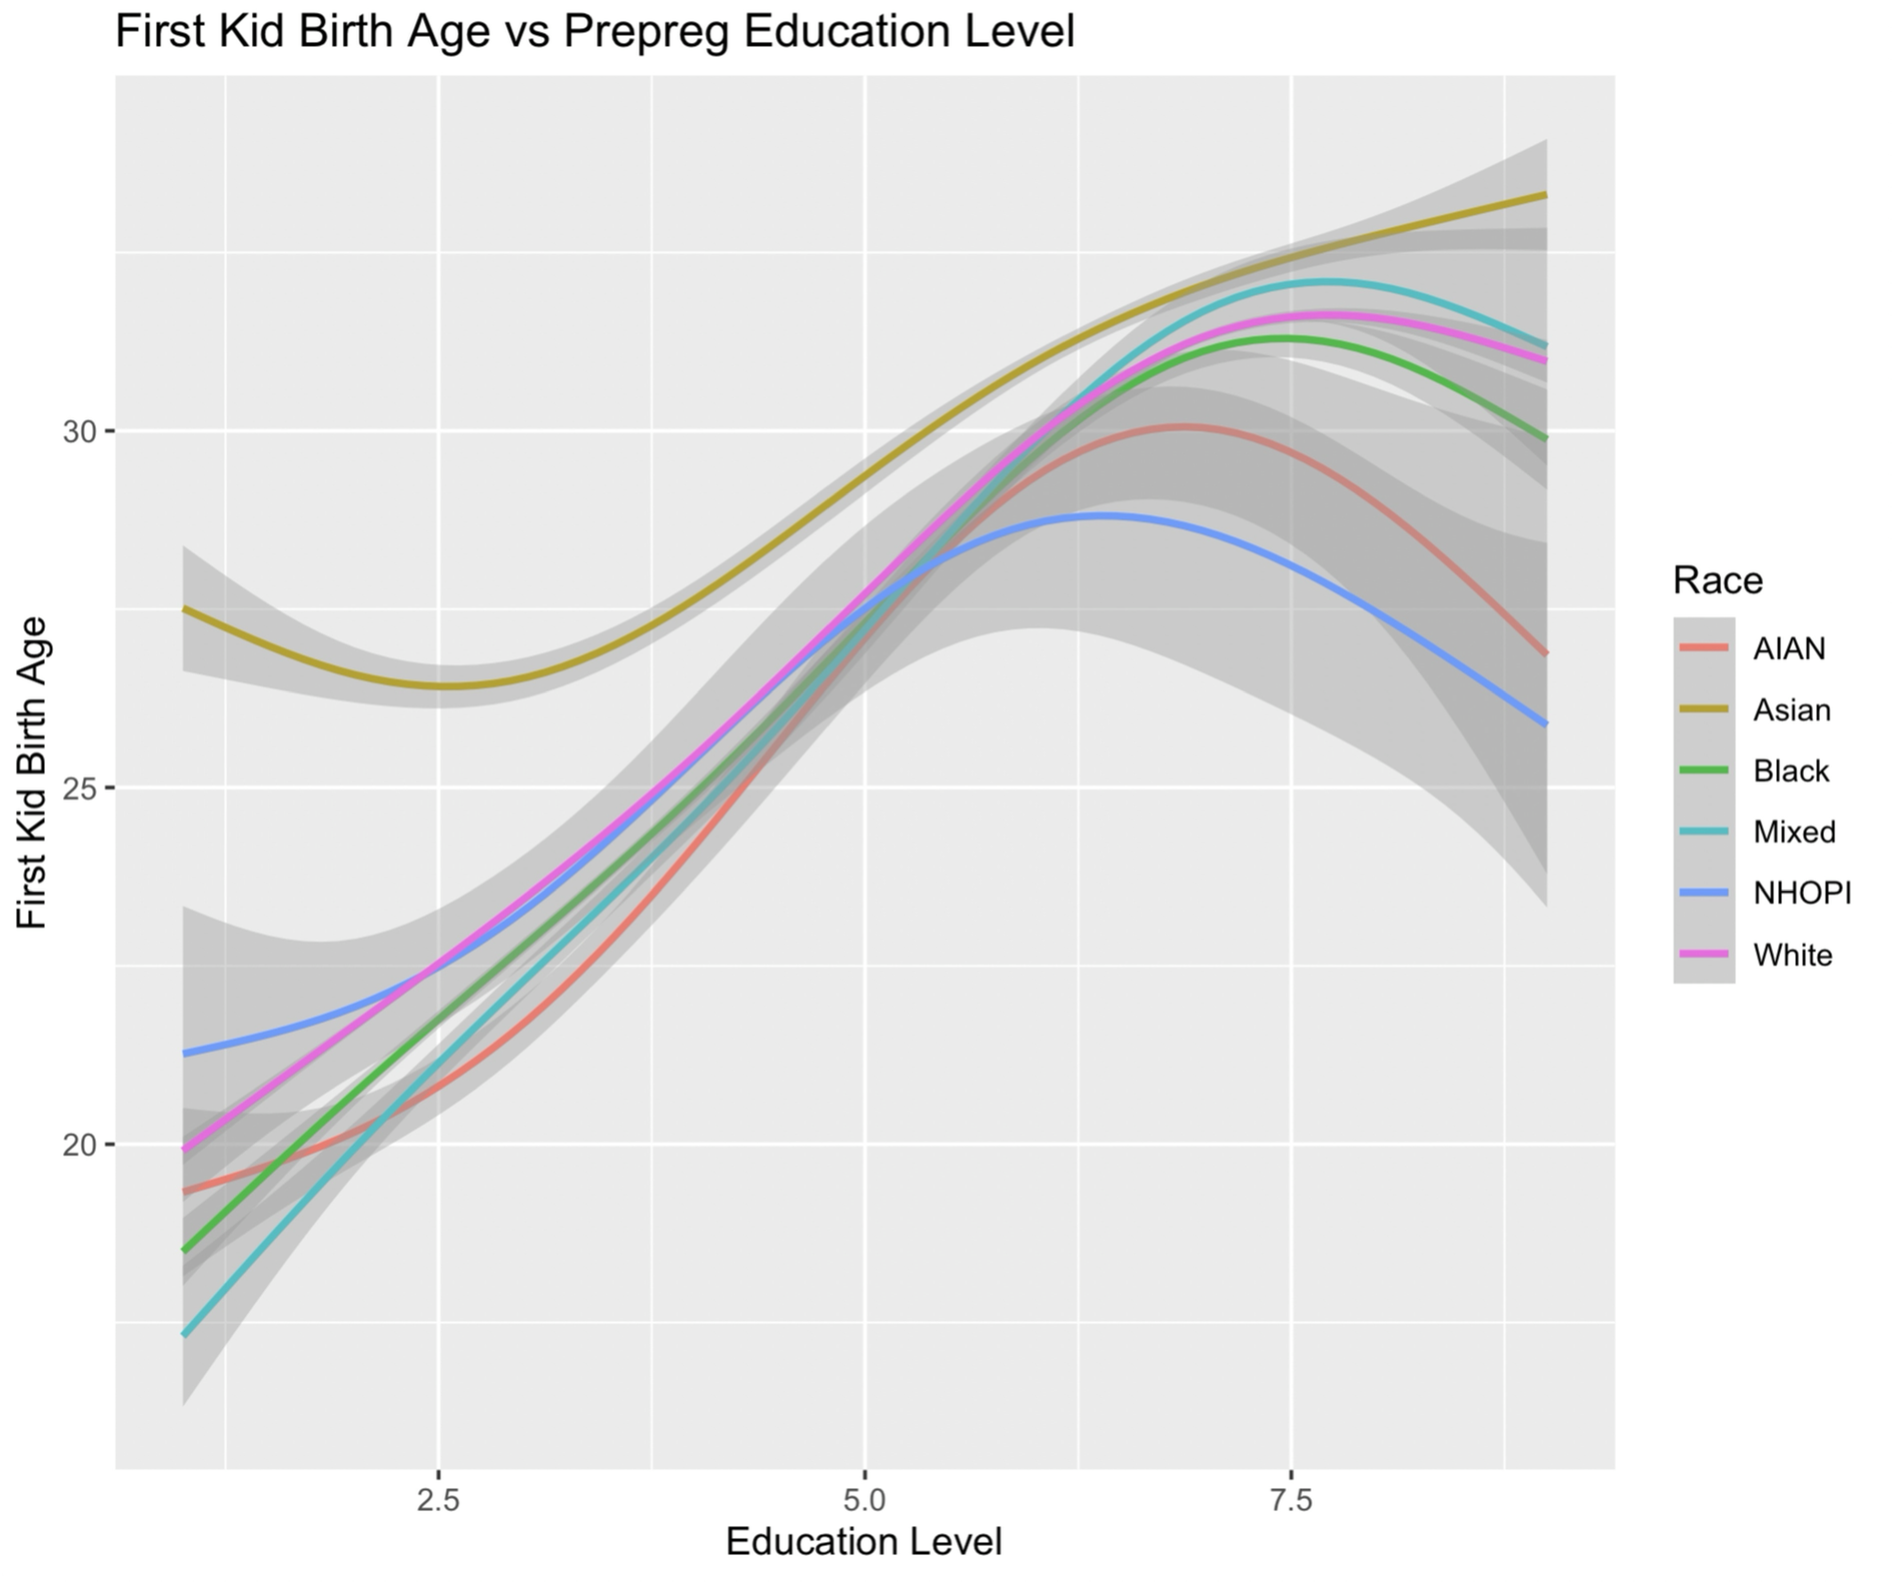 The “First Kid Birth Age vs Prepreg Education Level” plot graphically delineates the correlation between maternal age at the birth of the first child and the education level prior to pregnancy, with race as a categorical variable. The depicted trends across all racial groups suggest a positive association between educational attainment and the age at which a woman has her first child. This consistency in trend indicates that higher education levels are potentially correlated with delayed childbearing, a phenomenon supported by demographic studies linking educational pursuits to later maternity. The variations in trend slopes across different races may imply underlying socio-economic and cultural factors influencing reproductive decisions. The confidence intervals, while providing a measure of estimate reliability, indicate less precision at the extremes of education levels, reflecting the inherent variability and potentially lower data density at these points.
Diagram of Birthweight vs First Kid Birth Age 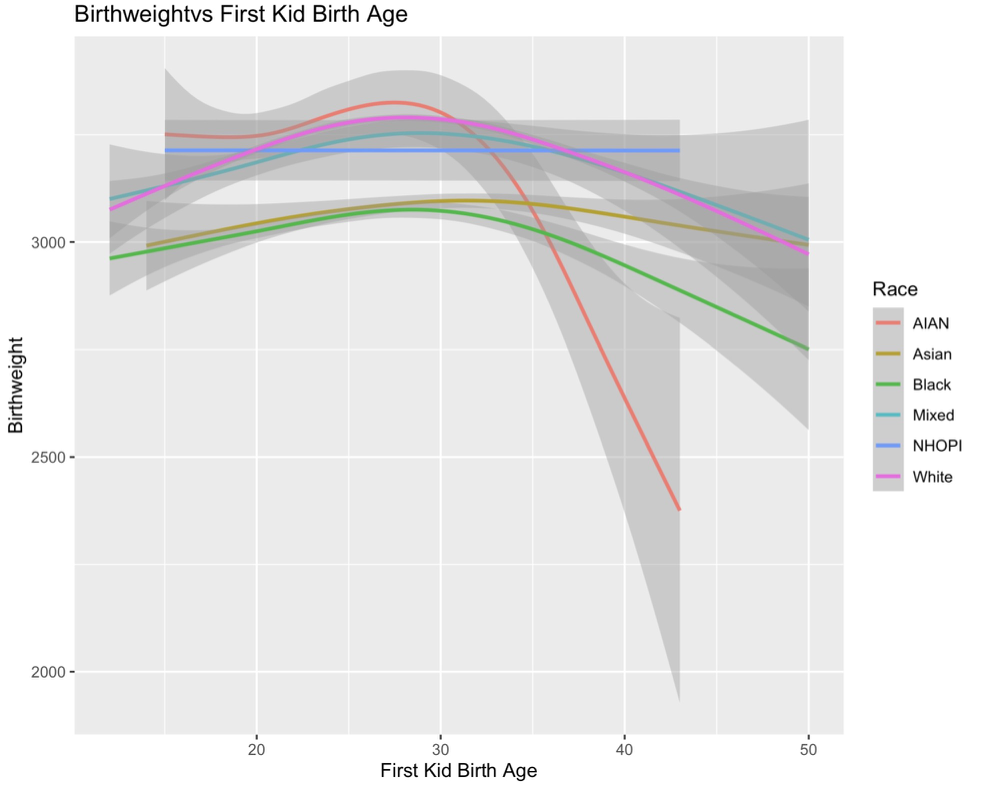 The plot visualizes the association between the birth weight of a child and the maternal age at the time of the first child’s birth, with race as a differentiating variable. The data suggests a non-linear relationship; for most racial groups, there is an initial increase in birth weight with maternal age, followed by a subsequent decline after a certain age threshold. The inference drawn from these trends could indicate a peak age range for optimal birth weight outcomes, which may vary by race. This peak likely reflects a complex interplay of biological and socio-economic factors, including health status and access to prenatal care. The width of the confidence intervals indicates varying degrees of certainty in the predictions, particularly at younger and older maternal ages, suggesting a need for cautious interpretation in these ranges. This pattern reiterates the significance of age as a factor in neonatal health.